http://www.sqlsaturday.com/678/Sessions/Details.aspx?sid=66680
 hectorv2
SSAS 2016 Tabular On Premise with Row-Level Security and Active Directory
This is a series of articles related to RLS (Row Level Security), started with http://hectorv.com/bringing-security-where-data-lives
We are going to implement RLS (Row-Level Security) in SSAS (SQL Server Analysis Services) Tabular mode.
In our use case: Adventure Works Internet Sales, the goal is to restrict access to all customer data to specific users. The user GHowell, is a sales agent based on United States. This user should only be able to retrieve customers from United States when query the SSAS database using Excel, Power BI desktop or any other BI tool.

To implement RLS, let’s download a Tabular Project sample “Adventure Works Internet Sales Tabular Sample Solution”, then we’ll add RLS to this project.
Go to:
https://msftdbprodsamples.codeplex.com/releases/view/125550
Download Adventure Works Internet Sales Tabular Sample Solution from the link as shown below.

Open the project in Visual Studio and deploy it in your SSAS instance. We should apply RSL security to the Customer table. The customer table information from customers from different countries and “Adventure Works” has sales agents in different countries that should only have access to the corresponding customer information.
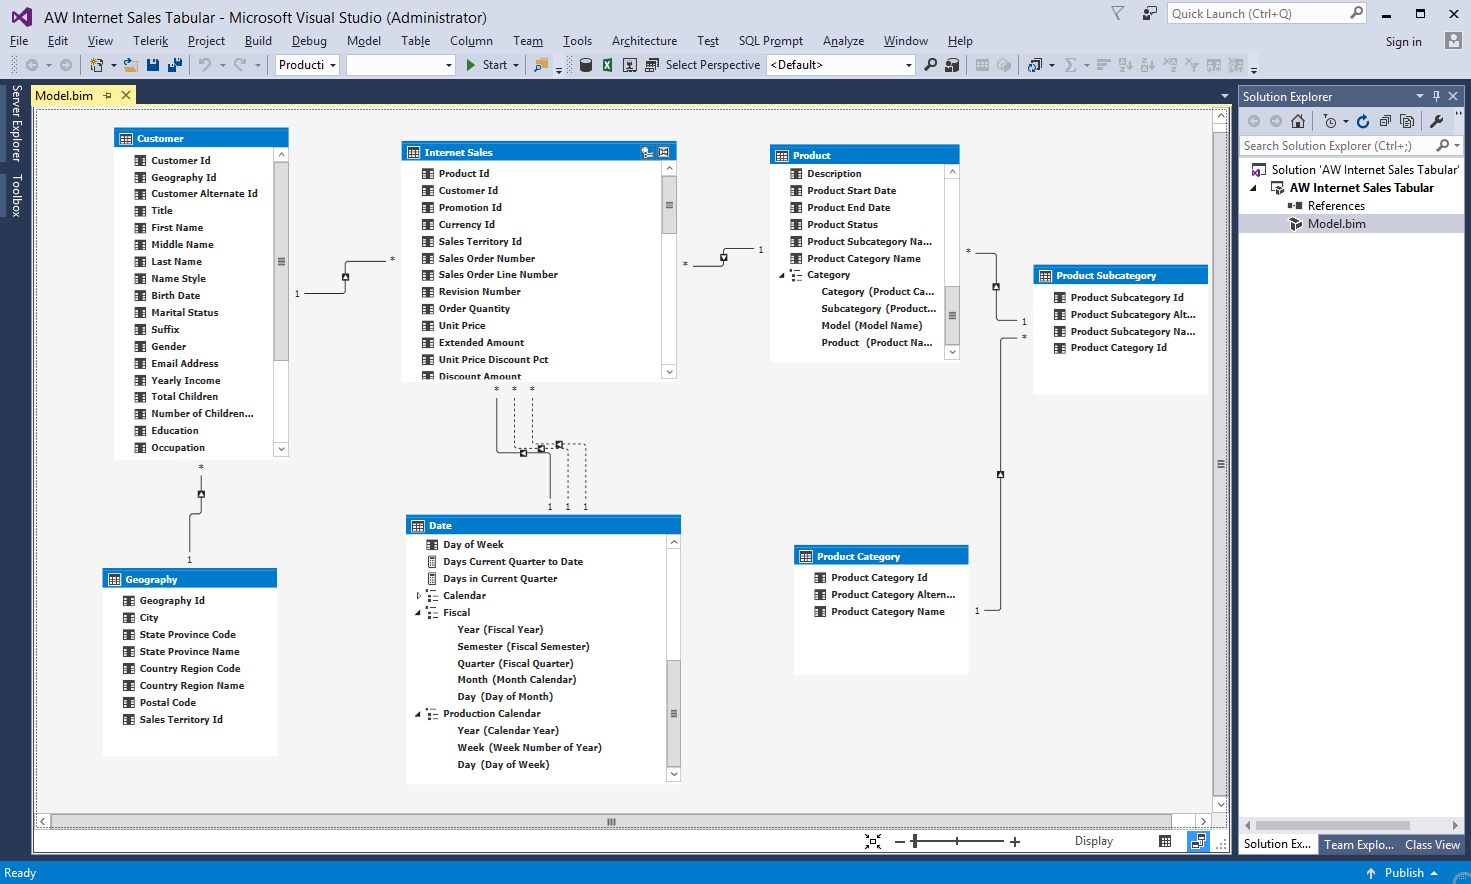
Notice the relationship between the Customer and Geography tables. The Row Level Security is disabled. Our plan is to apply RLS to the Geography table and the RLS will apply automatically to the Customer table, since there is a relationship between these two tables.

We are going to create a Role which have the security rules and membership.

=Geography[Country Region Code] = “GB”

Now, we add the membership in the Members tab. We add the active directory group that contains the “United Kingdom” sales agents.

Let’s test it!
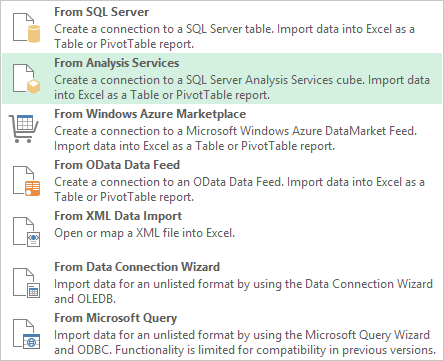
In order to do our security test, we’ll use Excel as a BI client tool. In Excel go to Data – From Other Sources and select “From Analysis Services”.
Then, you have to enter your SSAS instance. After this a data connection in your Excel file is created.
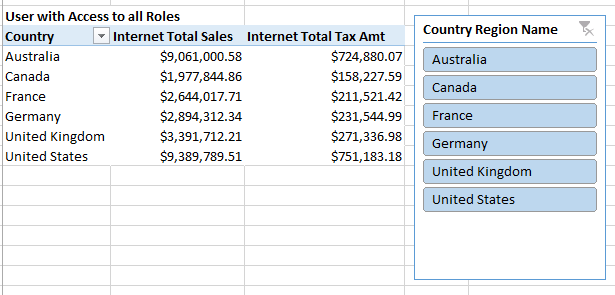
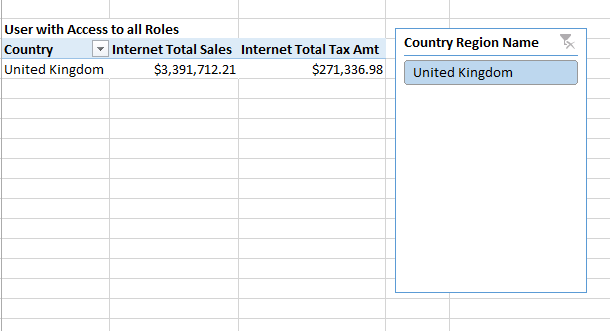
You can create a Pivot table like the one shown below. It will show all users since probably your user is an administrator will access to all information.
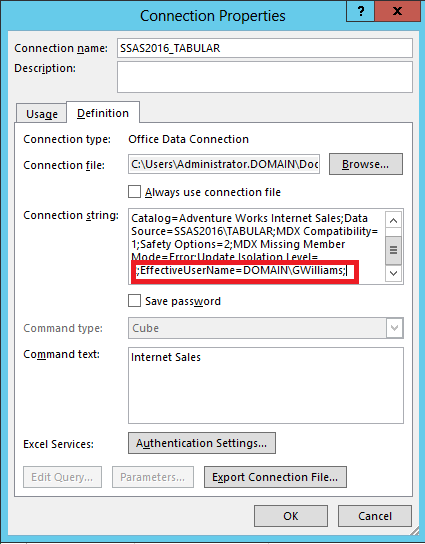
Now, In order to test a specific user, we need to change the connection. In Excel, go to Data, Connections and select the SSAS connection that you created before. Go to the definition tab as shown below.
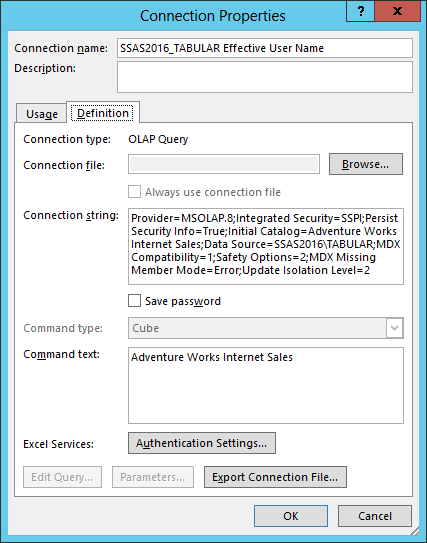
You are going to add an Effective user name to the connection string to simulate a query executed as another user. This will be allow only if you have administrator rights in the SSAS instance.
Try adding this at the end of the Connection String:
;EffectiveUserName=DOMAIN\GWilliams;
GWilliams is an active directory user that belongs to the “Internet Sales United Kingdom” AD group.
Click OK and you’ll see the data filtered only United Kingdom information as expected.
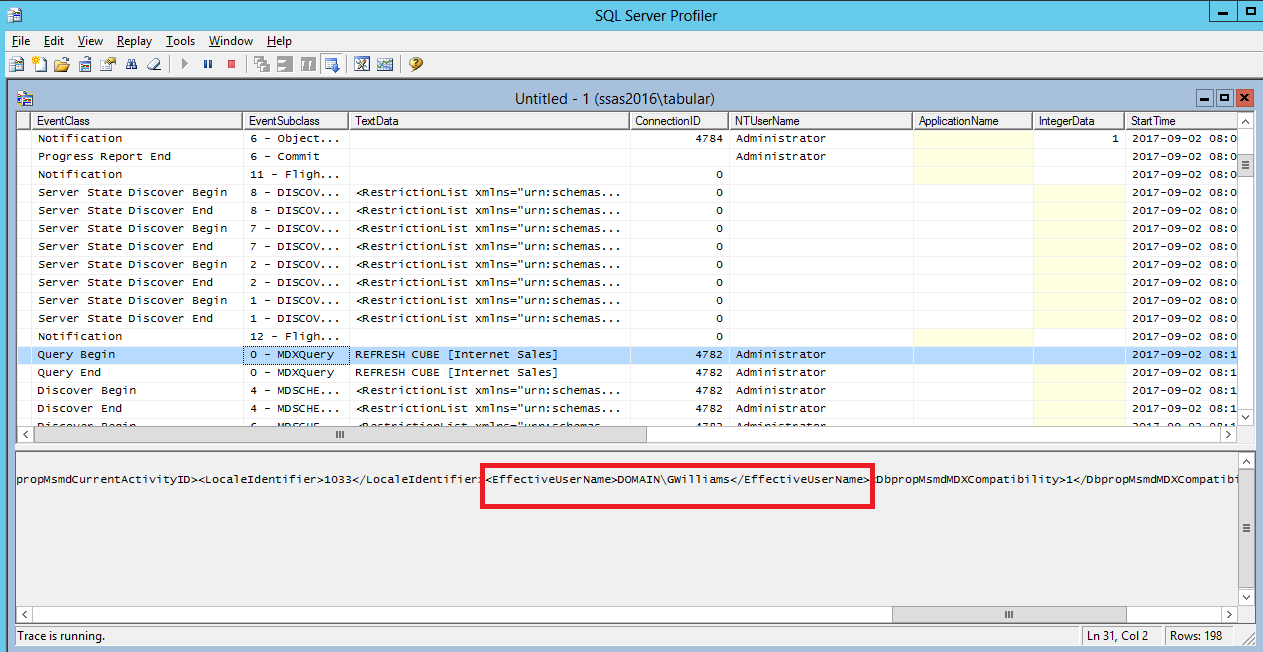
If you profile SSAS, you’ll be able to see that the Effective User name is sent with the query, then SSAS can check the AD membership and apply the corresponding Filter Rules defined in the SSAS Roles. Notice that Excel generate MDX queries instead of DAX queries.
In this article we learn how to implement RLS in SSAS tabular mode, and how to test it. In a following article, I’ll show you how to use this Tabular RLS security from Power BI with live connection.
There was extra effort to create this kind of report in PowerBI, back in April I published an article to implement different formats in the same column.
http://hectorv.com/table-or-matrix-for-side-by-side-column-comparison-with-columns-with-different-formats-in-the-same-column
Now, tt is extremely easy to have same result with no need of DAX measures to workaround different values, formats and alignment in a column.
You can download this Power BI desktop file with this link:
https://1drv.ms/u/s!AjlEiXFjD5fu2Sh0BaL-OPep9-Pe
There are many cases where we need to use a table or a matrix and we need to specify different formats in the same column. Showing the format with the numeric values makes the report easier to read than a simple number with no units.
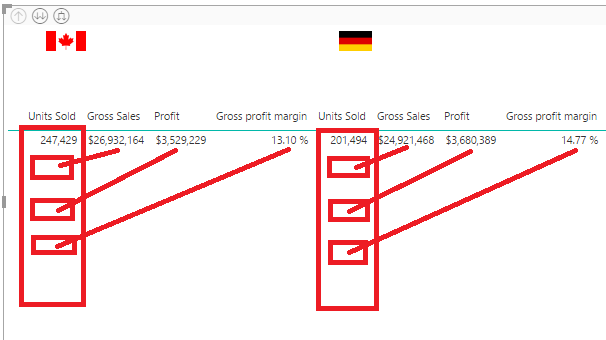
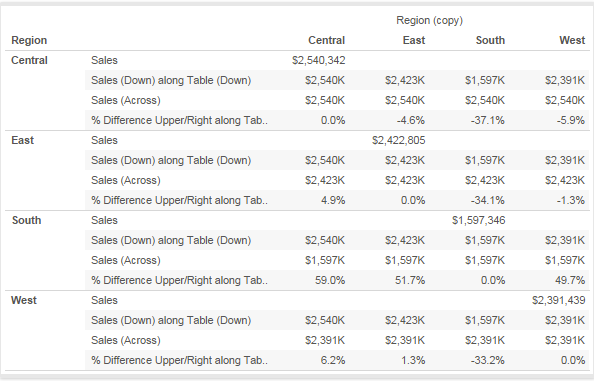
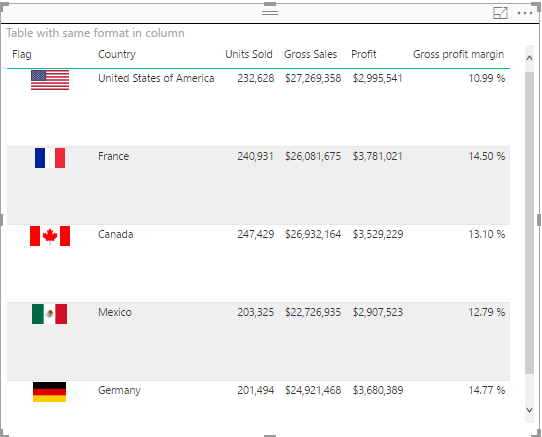
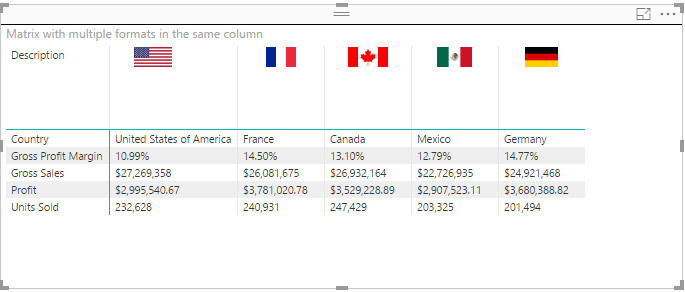
In the case of this financial report below, we can see three different formats in the same column:
Currency ($), Currency and Thousand ($K), and Percent (%).

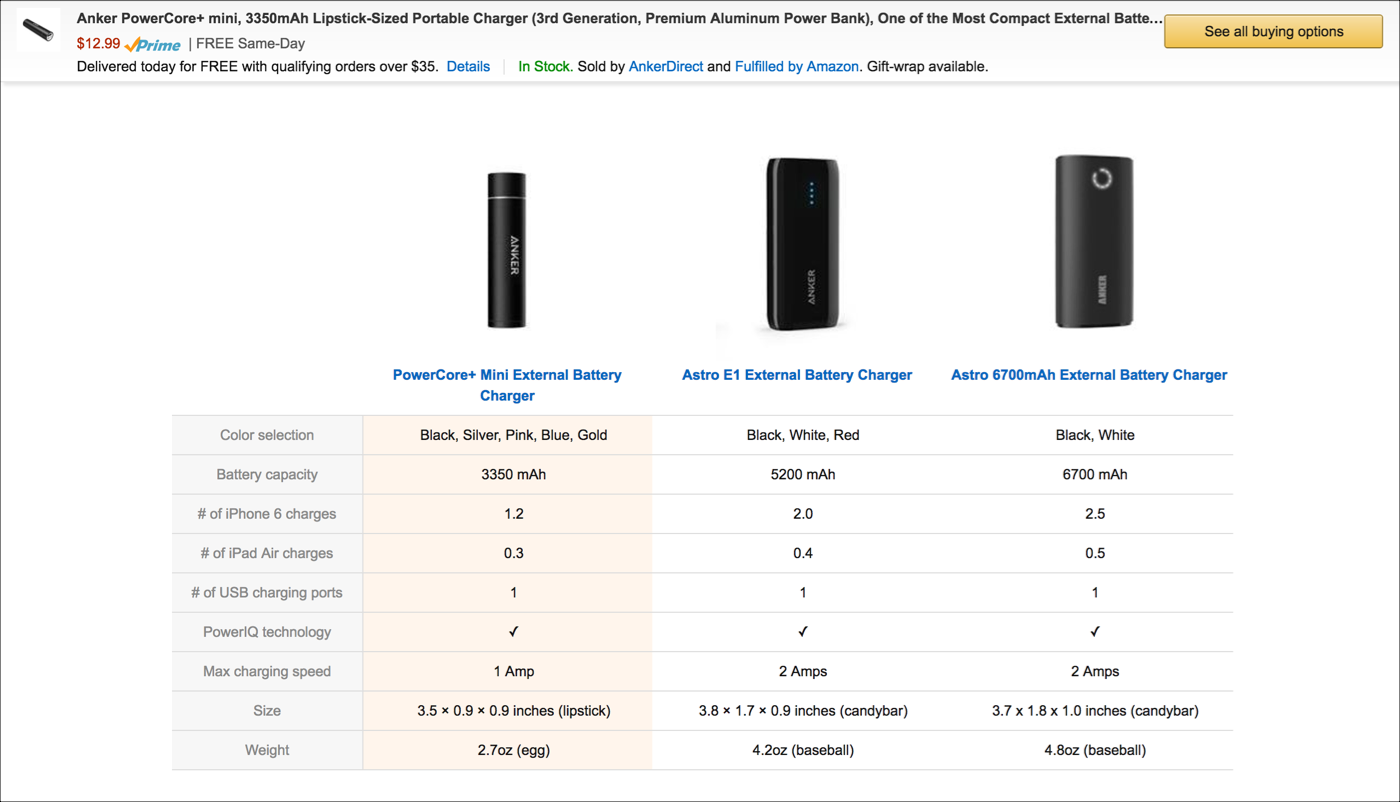
Another example is a side by side comparison of products. In the case below, we have different formats like: text, mAh, decimal number, Whole number and Amp formats, all of them in the same column.

I’ll show you this solution based on financial sample data downloaded from:
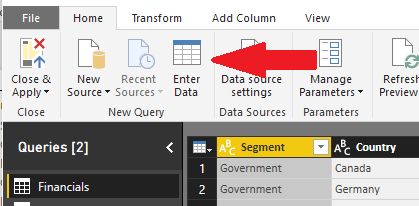
This spreadsheet will be imported using Power BI desktop and you have to choose the worksheet: financial. Notice that this solution works for both: Power BI imported mode and live connection mode to SSAS Tabular. In the case of SSAS Tabular, you would have to import the excel spreadsheet in the Visual Studio Project.
I created a flag URL for the image, which is not part of the objective for this article. Even though, I’ll show you the calculated column formula created in the Financial Table:
Flag = "https://image.ibb.co/" & SWITCH([Country],"France","d4vwba/fr.png","Mexico","h8uHhF/mx.png","Germany","nGmV2F/de.png","Canada","dsjuUv/ca.png","United States of America","c023NF/us.png")
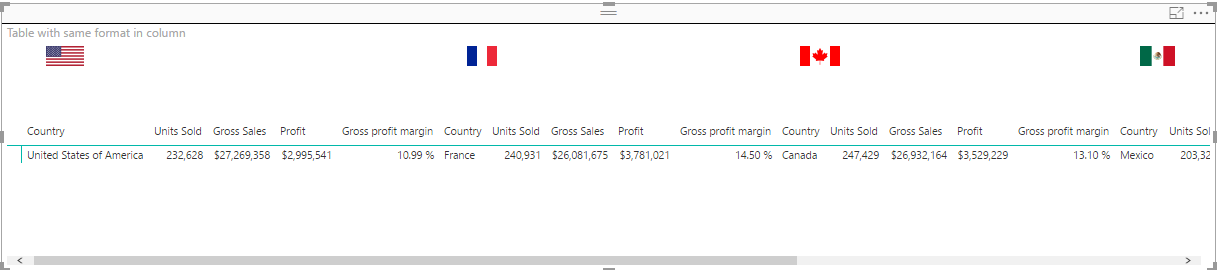
The following table was easy to create. Each country has a row and we can do a row by row comparison.

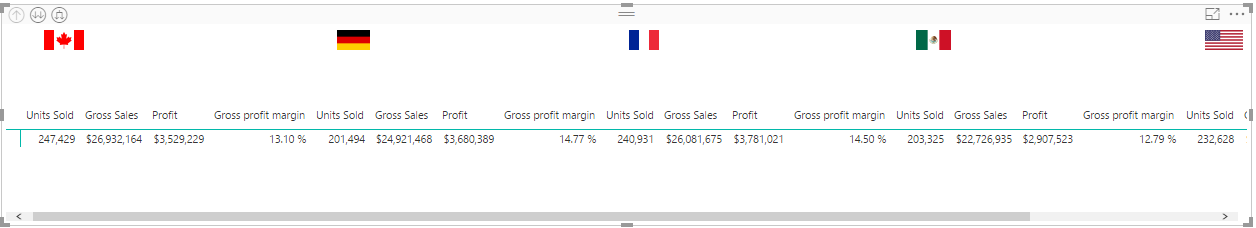
Even though is not what we are looking for. We are trying to get a side by side column comparison. We can create a matrix as shown below.

This is the Matrix Report version, after changing the flag and Country fields to the Column section in the Matrix. All fields under the configured Values section are shown as multiple columns.
What I really want is only one column per country and also the columns header in the left side of the table as the very first column.
The Solution
In the formatting options under Values go and turn on the new formatting option: “Show in rows”.
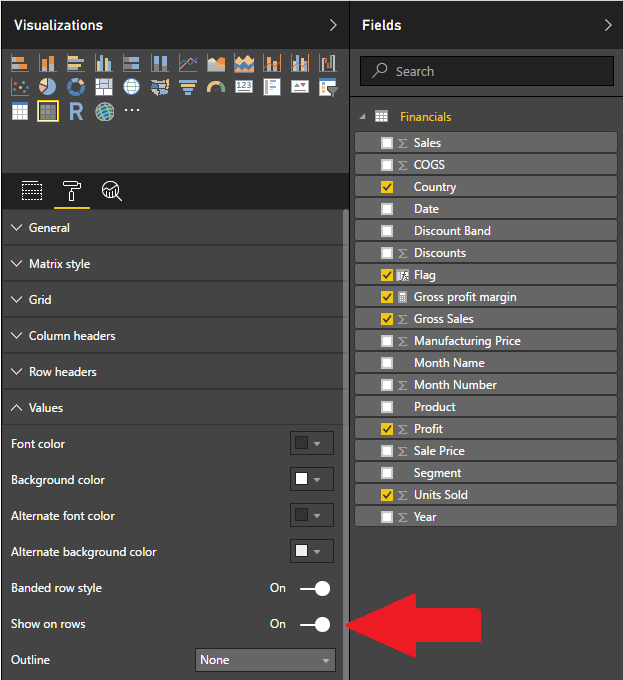
This will show the table well align and with different formats under the same column.

We add some slicers and we have both versions side by side matrix and simple table.
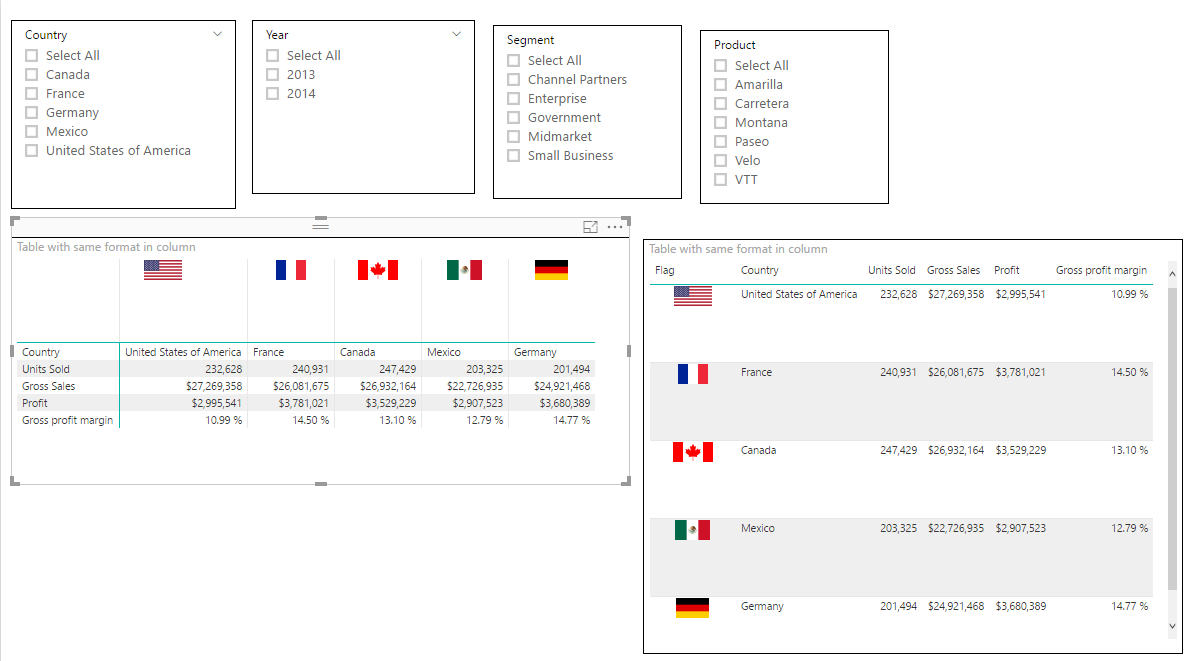
There are some cases where the side by side comparison in column and the formatted values are much easier to read than table with rows by row comparison. Especially, when there are multiple items or rows, it is easier for the end-user to compare columns side by side, where you can scroll up and down rather than scroll the table horizontally in a row by row comparison.
You can download this Power BI desktop file with this link:
In the previous article, I introduced a simple way to implement Row-Level-Security implementation for Microsoft SQL Server 2016 database with Active Directory.
Here, I’ll show you a more efficient way to implement RLS when you deal with millions of records in your database and thousands of users in your active directory.
Below is the original implementation of a RLS security predicate:
CREATE FUNCTION RLS.GeographyAccessPredicate(@GeographyKey AS INT)

RETURNS TABLE

WITH SCHEMABINDING

AS

RETURN SELECT 1 AS AccessResult

FROM dbo.DimGeography G

WHERE

G.GeographyKey = @GeographyKey AND

(

(

G.CountryRegionCode = 'US' AND IS_MEMBER('DOMAIN\AW United States') = 1

)

OR

(

G.CountryRegionCode = 'GB' AND IS_MEMBER('DOMAIN\AW United Kingdom') = 1

)

OR

(

G.CountryRegionCode = 'DE' AND IS_MEMBER('DOMAIN\AW Germany') = 1

)

OR

(

G.CountryRegionCode = 'FR' AND IS_MEMBER('DOMAIN\AW France') = 1

)

OR

(

G.CountryRegionCode = 'CA' AND IS_MEMBER('DOMAIN\AW Canada') = 1

)

OR

(

G.CountryRegionCode = 'AU' AND IS_MEMBER('DOMAIN\AW Australia') = 1

)

)
There are two performance issues in this filter predicate. First, there is a WHERE condition that slows down the query performance. The GeographyAccessPredicate function contains OR conditions for each country, which it will denied the use of indexes in the tables.
Second, we use a function called IS_MEMBER, which evaluate whether the current user is a member of the specified Active Directory group. This function will execute poorly when we query tables with millions of rows and we have thousands of active directory users and groups in our domain.
In order to improve the performance, instead of calling IS_MEMBER function, I’m going to create a table in the database to keep Active Directory users and groups. This Active Directory user and group table will allow me to join the data with the table and remove the function IS_MEMBER from the security policy predicate. It will simplify and improve the performance of the query execution.
CREATE TABLE [dbo].[DimActiveDirectoryUser](

[LoginName] [varchar](50) NOT NULL,

[GroupName] [varchar](150) NOT NULL,

CONSTRAINT [PK_DimActiveDirectoryUser] PRIMARY KEY CLUSTERED

(

[LoginName] ASC,

[GroupName] ASC

)WITH (PAD_INDEX = OFF, STATISTICS_NORECOMPUTE = OFF, IGNORE_DUP_KEY = OFF, ALLOW_ROW_LOCKS = ON, ALLOW_PAGE_LOCKS = ON) ON [PRIMARY]

) ON [PRIMARY]

In order to populate this table, we can execute a Power Shell script or create a ADSI linked server. In this article, I’ll use ADSI linked server:

USE [master]

GO

EXEC master.dbo.sp_addlinkedserver @server = N'ADSI', @srvproduct=N'Active Directory Service Interfaces', @provider=N'ADSDSOObject', @datasrc=N'adsdatasource'

EXEC master.dbo.sp_addlinkedsrvlogin @rmtsrvname=N'ADSI',@useself=N'False',@locallogin=NULL,@rmtuser=N'domain\YourUser',@rmtpassword='Your Password'

GO

EXEC master.dbo.sp_serveroption @server=N'ADSI', @optname=N'collation compatible', @optvalue=N'false'

GO

EXEC master.dbo.sp_serveroption @server=N'ADSI', @optname=N'data access', @optvalue=N'true'

GO

EXEC master.dbo.sp_serveroption @server=N'ADSI', @optname=N'dist', @optvalue=N'false'

GO

EXEC master.dbo.sp_serveroption @server=N'ADSI', @optname=N'pub', @optvalue=N'false'

GO

EXEC master.dbo.sp_serveroption @server=N'ADSI', @optname=N'rpc', @optvalue=N'false'

GO

EXEC master.dbo.sp_serveroption @server=N'ADSI', @optname=N'rpc out', @optvalue=N'false'

GO

EXEC master.dbo.sp_serveroption @server=N'ADSI', @optname=N'sub', @optvalue=N'false'

GO

EXEC master.dbo.sp_serveroption @server=N'ADSI', @optname=N'connect timeout', @optvalue=N'0'

GO

EXEC master.dbo.sp_serveroption @server=N'ADSI', @optname=N'collation name', @optvalue=null

GO

EXEC master.dbo.sp_serveroption @server=N'ADSI', @optname=N'lazy schema validation', @optvalue=N'false'

GO

EXEC master.dbo.sp_serveroption @server=N'ADSI', @optname=N'query timeout', @optvalue=N'0'

GO

EXEC master.dbo.sp_serveroption @server=N'ADSI', @optname=N'use remote collation', @optvalue=N'true'

GO

EXEC master.dbo.sp_serveroption @server=N'ADSI', @optname=N'remote proc transaction promotion', @optvalue=N'true'

GO
Be sure to replace the values for the following parameters @rmtuser=N’domain\YourUser’,@rmtpassword=’Your Password’.
The following is the script used to synchronize our active directory with the new table DimActiveDirectoryUser in the AdventureWorks database. Notice that I only synchronize the groups that start with the wildcard: “AW*”, since they are the only groups used in my application.
USE AdventureWorksDW2014

GO

TRUNCATE TABLE DimActiveDirectoryUser

GO

DECLARE @GroupName VARCHAR(50)

DECLARE db_cursor CURSOR FOR

SELECT CN

FROM OpenQuery(ADSI,

'SELECT cn, ADsPath FROM ''LDAP://DC=domain,DC=com'' WHERE objectCategory=''group'' AND cn=''AW*'''

)

OPEN db_cursor

FETCH NEXT FROM db_cursor INTO @GroupName

WHILE @@FETCH_STATUS = 0

BEGIN

DECLARE @OPENQUERY nvarchar(4000), @TSQL nvarchar(4000), @LinkedServer nvarchar(4000)

SET @LinkedServer = 'ADSI'

SET @OPENQUERY = 'INSERT INTO DimActiveDirectoryUser(LoginName, GroupName) '

SET @OPENQUERY = @OPENQUERY + ' SELECT sAMAccountName, ''' + @GroupName + ''' FROM OPENQUERY('+ @LinkedServer + ','''

--SET @OPENQUERY = 'SELECT sAMAccountName as Login, CN as Name, GivenName as FirstName,SN as LastName, DisplayName as FullName, UserAccountControl FROM OPENQUERY('+ @LinkedServer + ','''

SET @TSQL = 'SELECT sAMAccountname,givenname,sn,displayname,useraccountcontrol,CN, department FROM ''''LDAP://domain.com/DC=domain,DC=com'''''

SET @TSQL = @TSQL + ' WHERE objectCategory=''''person'''' '

SET @TSQL = @TSQL + ' AND objectClass=''''user'''''

SET @TSQL = @TSQL + ' AND memberOf=''''CN=' + @GroupName + ',OU=AdventureWorks,DC=domain,DC=com'''' '

SET @TSQL = @TSQL + ' '')'

PRINT @TSQL

EXEC (@OPENQUERY+@TSQL)

PRINT @TSQL

FETCH NEXT FROM db_cursor INTO @GroupName

END

CLOSE db_cursor

DEALLOCATE db_cursor

GO

-- Update values to Match Predicate Conditions

UPDATE DimActiveDirectoryUser SET LoginName = 'DOMAIN\' + LoginName, GroupName = REPLACE(GroupName,'AW ','')
Notice that the last update to the LoginName and GroupName facilitates a better match in our security predicate.
Finally, the security predicate is simplified. No more OR conditions or IS_MEMBER function in the security predicate. GeographyAccessPredicate is a join between the DimGeography and the DimActiveDirectoryUser tables.
DROP SECURITY POLICY RLS.AWSecurityPolicy

go

DROP FUNCTION RLS.GeographyAccessPredicate

go

CREATE FUNCTION RLS.GeographyAccessPredicate(@GeographyKey AS INT)

RETURNS TABLE

WITH SCHEMABINDING

AS

RETURN SELECT 1 AS AccessResult

FROM dbo.DimGeography G

INNER JOIN dbo.DimActiveDirectoryUser U

ON G.GeographyKey = @GeographyKey AND

U.LoginName = SUSER_NAME()

AND G.EnglishCountryRegionName = U.GroupName

GO

CREATE SECURITY POLICY RLS.AWSecurityPolicy

ADD FILTER PREDICATE RLS.GeographyAccessPredicate(GeographyKey) ON dbo.DimCustomer
The performance was improved 2X compared with initial version of the security predicate. You’ll notice this difference when dealing with millions of records and thousand users in your active directory. It also depends of the SQL Server configuration.
The following is the query execution plan with the RLS security.
-- Show Plan with Security

ALTER SECURITY POLICY RLS.AWSecurityPolicy WITH (STATE=ON)

GO

SET SHOWPLAN_ALL ON

GO

SELECT COUNT(*) FROM DimCustomer

GO

SET SHOWPLAN_ALL OFF
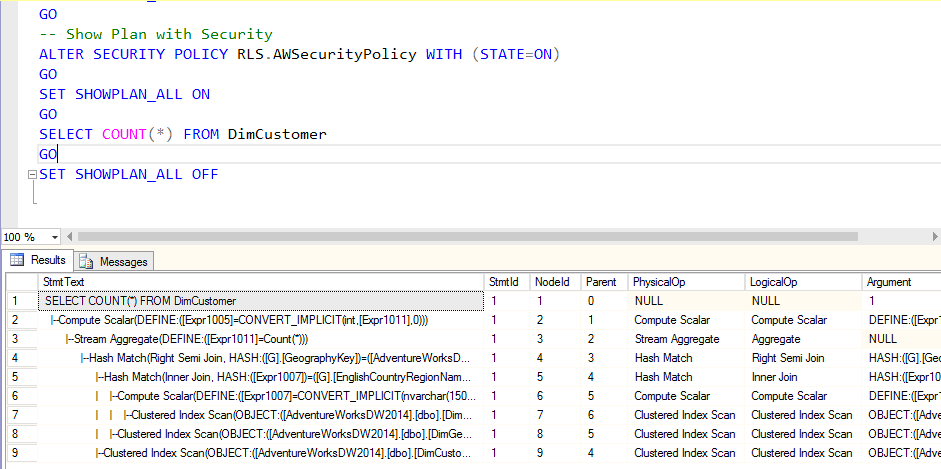
When implementing RLS keep in mind that there is always an overhead in performance when querying a secured table with RLS. The performance of the queries results depends on how you implement the WHERE condition logic and this logic can be optimized using indexes in the joined fields and avoiding complex functions in your RLS security policy.
In this article, I’ll explain a basic use case of Row-Level-Security implementation for Microsoft SQL Server 2016 database.
The AdventureWorks Database supports a fictitious, multinational manufacturing company called Adventure Works Cycles. This company sells products around the world. Sales are ordered from five different countries like Unites States, Germany, United Kingdom, Canada, France and Australia.
Adventure Works Cycles has Sales Teams in each of these countries. These teams should only access to data from their corresponding country.
In the picture below, we can see that Ginger Howell, a sales representative from the United States Sales Team, is trying to get information from the Customer Dimension table (Dim Customer).
When GHowell send the query: “SELECT * FROM DimCustomer” to the database. The DimCustomer table contains customer records not only from USA, but from other countries. The database should retrieve to GHowell only the records corresponding to United States Customers.
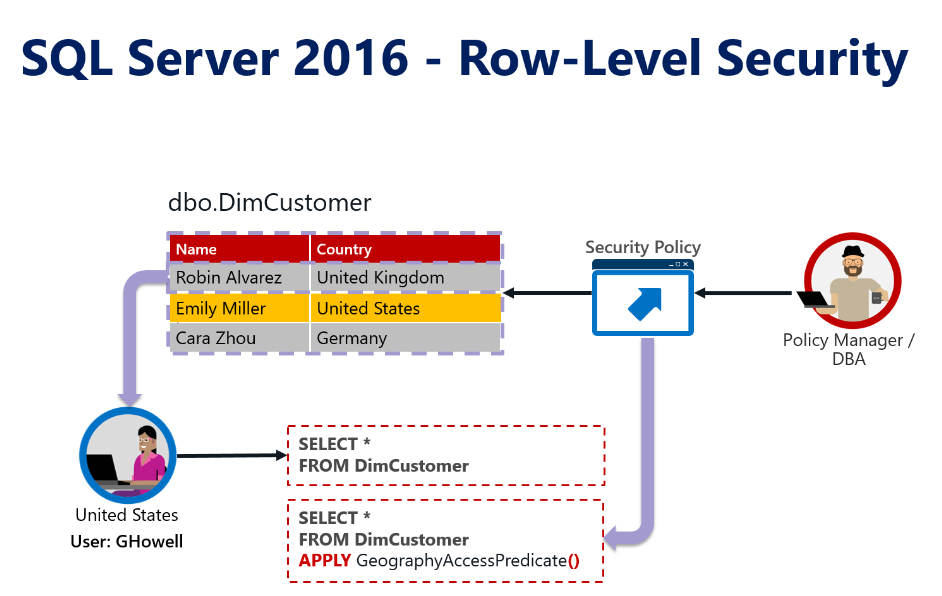
SQL Server 2016 introduced a new feature the database engine: Row-Level-Security. Row Level Security (RLS) is a concept that provides security at the table row level within the database layer, instead of at the application layer. RLS is accomplished by using a function (predicate) and the security policy that should be implemented by a database administrator.
We are going to use Adventure Works Database as a sample. You can download the database from this link: https://msftdbprodsamples.codeplex.com/releases/view/125550
Download and restore the Adventure Works DW 2014 Full Database Backup.zip
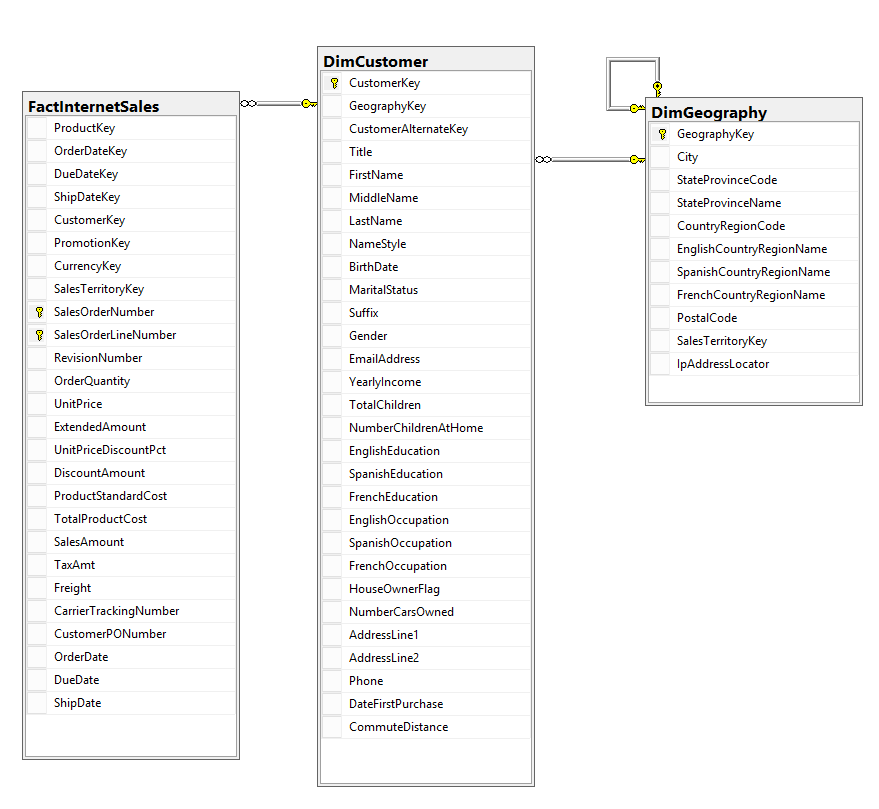
The following is a simplified diagram that includes only three tables from the Adventure Works database: DimCustomer, DimGeography and FactInternetSales
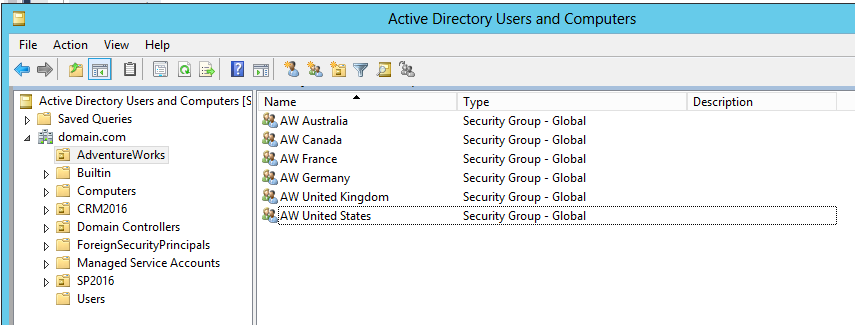
Now, we have Active directory groups corresponding to each country’s sales team.
We create a SQL Login for each of these Active Directory groups.

With the SQL Logins created, we can implement our security policy.
First, we create a new schema, just to keep SQL objects separate from the existing objects.
CREATE SCHEMA RLS
We create the function that we’ll use as a filter predicate for the security policy.
The predicate function is an inline table valued function. This function returns 1 when a row in the DimGeography table matches the corresponding CountryRegionCode (G.CountryRegionCode = ‘US’) and the user executing the query belongs to the corresponding Active Directory group (IS_MEMBER(‘DOMAIN\AW United States’) = 1).
CREATE FUNCTION RLS.GeographyAccessPredicate(@GeographyKey AS INT)

RETURNS TABLE

WITH SCHEMABINDING

AS

RETURN SELECT 1 AS AccessResult

FROM dbo.DimGeography G

WHERE

G.GeographyKey = @GeographyKey AND

(
 (
    G.CountryRegionCode = 'US' AND IS_MEMBER('DOMAIN\AW United States') = 1

  )
  OR

 (
    G.CountryRegionCode = 'GB' AND IS_MEMBER('DOMAIN\AW United Kingdom') = 1
 )
  OR
 (
     G.CountryRegionCode = 'DE' AND IS_MEMBER('DOMAIN\AW Germany') = 1
 )
  OR
  (
     G.CountryRegionCode = 'FR' AND IS_MEMBER('DOMAIN\AW France') = 1
   )
  OR
   (
     G.CountryRegionCode = 'CA' AND IS_MEMBER('DOMAIN\AW Canada') = 1
   )
  OR
  (
    G.CountryRegionCode = 'AU' AND IS_MEMBER('DOMAIN\AW Australia') = 1
  )
)
Finally, we add the function as filter predicate on the DimCustomer table:
CREATE SECURITY POLICY RLS.AWSecurityPolicy

ADD FILTER PREDICATE RLS.GeographyAccessPredicate(GeographyKey) ON dbo.DimCustomer
After this our Row-Level-Security is implemented!
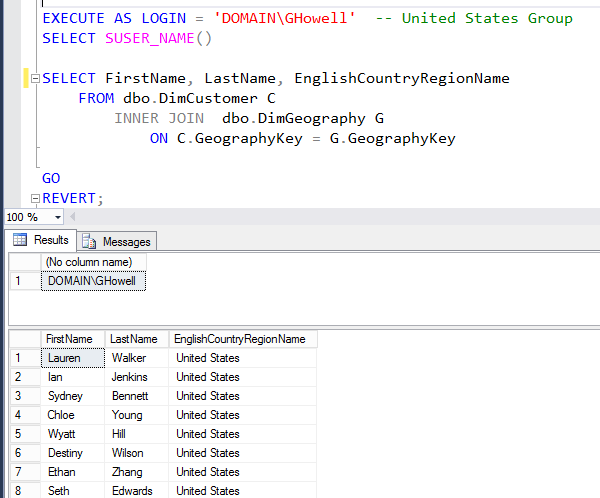
Now, we’ll test it by running some scripts. We impersonate a user, GHowell, which belongs to the United States Active Directory.
EXECUTE AS LOGIN = 'DOMAIN\GHowell' -- United States Group

SELECT SUSER_NAME()

SELECT FirstName, LastName, EnglishCountryRegionName

FROM dbo.DimCustomer C

INNER JOIN dbo.DimGeography G

ON C.GeographyKey = G.GeographyKey
The query returns only customers from United States region as expected.
Execute the Revert command to return the execution context back to your user.
REVERT;
Now let’s see what happens behind scenes when the query is executed.
-- Show Plan without Security
GRANT SHOWPLAN TO [DOMAIN\Administrator]
GO
ALTER SECURITY POLICY RLS.AWSecurityPolicy WITH (STATE=OFF)
GO
SET SHOWPLAN_ALL ON
GO
SELECT COUNT(*) FROM DimCustomer
GO
SET SHOWPLAN_ALL OFF

The execution plan shows a simple scan to the DimCustomer table, when the security policy is off.
Now, let’s see how is the execution plan when the security policy is applied.
-- Show Plan with Security

ALTER SECURITY POLICY RLS.AWSecurityPolicy WITH (STATE=ON)
GO
SET SHOWPLAN_ALL ON
GO
SELECT COUNT(*) FROM DimCustomer
GO
SET SHOWPLAN_ALL OFF
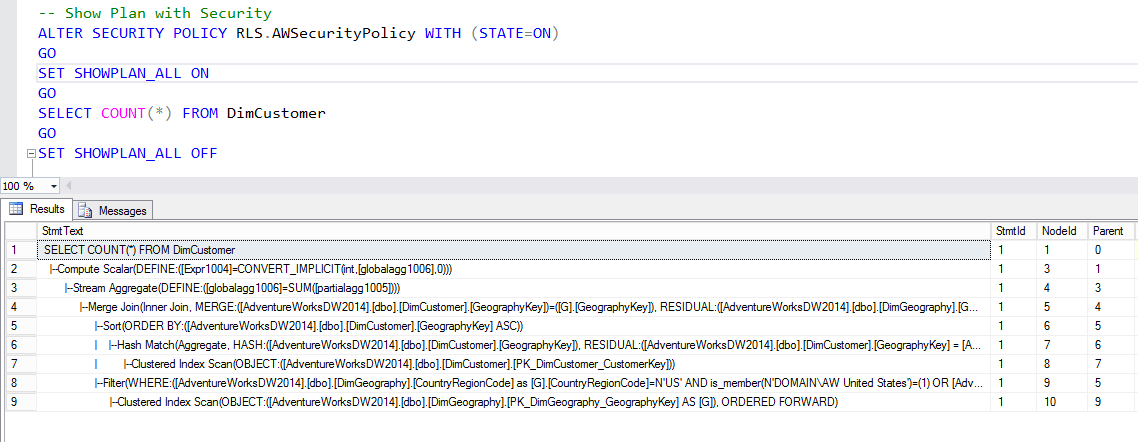
When the security policy applied, the execution plan shows an extra join. The filter predicate is being applied and joined to the DimCustomer table.
There is an overhead when Row-Level-Security is applied. This impact in the performance of the queries is affected by the implementation of the filter predicate function.
In our filter predicate function GeographyAccessPredicate, there is a WHERE condition that slows down the query performance. The GeographyAccessPredicate function contains OR conditions for each country, which it will denied the use of indexes in the tables.
Second, we use the function called IS_MEMBER, which evaluate whether the current user is a member of the specified Active Directory group. This also will execute poorly when we query tables with millions rows.
In the next article, I will show a better approach for the predicate function, to speed up the query performance.
http://hectorv2.optimumclick.com/wp-content/uploads/sites/10/2017/06/RLS-SQL-Saturday-1.pptx

The following is a series of articles that explain how we can use Row Level Security (RLS) and Active Directory across all BI technologies, database and tools in the corporate environment.
The goal is to create an integrated and a comprehensive data access control across multiple database technologies using different BI Tools or Apps.
SQL Server 2016 and Power BI started to support Row-Level-Security last year. RLS was already supported by SQL Server Analysis Services (SSAS) with Tabular and Multidimensional for some time.
The following picture shows some BI Tools and Databases used in the Microsoft BI Ecosystem.
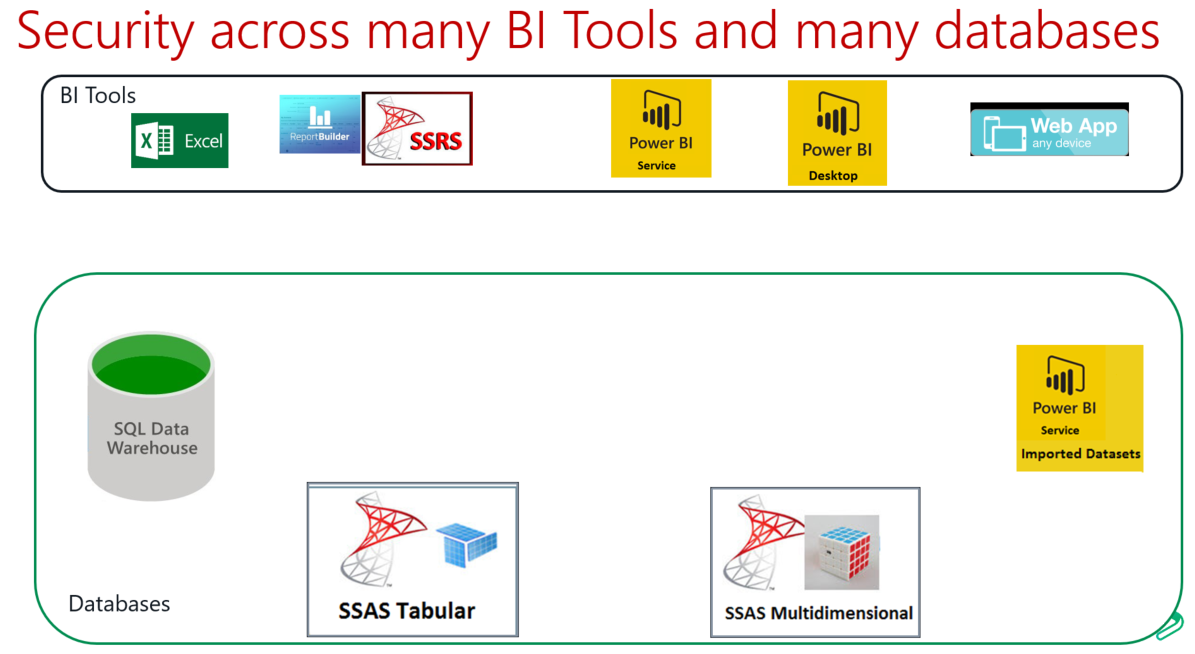
On the top we have BI Tools used for authoring, publishing and hosting reports like:
On the bottom we have a variety of databases:
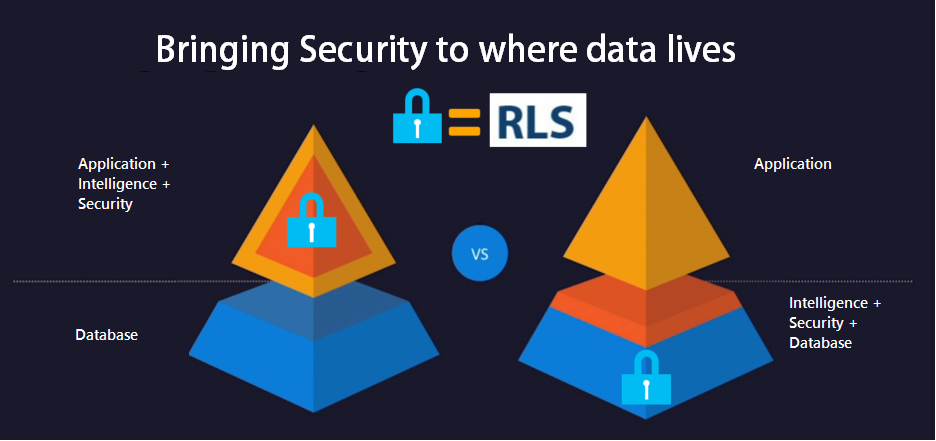
Traditionally, BI applications used to implement all rules regarding the data security within the application. For example we can have a BI App that implement security that allow users or group of users to access only to some specific set of data. The problem with this approach is it does not allow to reuse this security among other BI Tools. For example we can have security implemented in SSRS for folders and report level permissions or connections. Even though this SSRS security cannot be reused by Power BI nor Excel.
The best place to implement the security is right within the database, where the security can be centralized and maintained in only one place. On this way, any BI Tool or any App that uses the database, will also use the implemented security without the need to implement security in every single Web App or Tool.
The following picture shows a comparison of a database and application features. Business Intelligence and Security used to be common responsibilities of and application. Now databases have more powerful features in terms of business intelligence and security and these responsibilities can be implemented now in the database.
In order to implement a centralized and reusable security, we have to use these two security features available in all databases (Relational SQL, SSAS Tabular, SSAS Multidimensional):
Implementing security in the database using RLS and AD give us the flexibility to use any BI tool that can connect to our database using an Active Directory account and our database will be protected using centralized security rules implemented right in the database.
In the following articles, I will implemented RLS and AD security across all these technologies and all BI tools. In these articles I will be share code samples, I’ll show How to unit test the security and also How to troubleshoot the security.
The following list is the series of articles to be publish related with this topic:
SQL Server 2016 On-Premise with Row-Level Security with Active Directory (Part I)
SQL Server 2016 On-Premise with Row-Level Security with Active Directory (Part II)
SSAS 2016 Tabular On Premise with Row-Level Security and Active Directory.
Client App Security (MVC, Web Forms, Web API) with SQL 2016 RLS and Active Directory
Power BI Security with Active Directory Synch and On-Premise Data Gateway.
Power BI using SSAS Tabular with Row Level Security.
Power BI using SSAS Multidimensional with Row Level Security.
Power BI – Imported Data with Row Level Security.
Power BI – Direct Query with Row Level Security.
Power BI: Integrate Power BI dashboard with a web application.
Note: This article was updated with a new formatting feature released. See the updated version of this article:
http://hectorv.com/table-or-matrix-for-side-by-side-column-comparison-with-columns-with-different-formats-in-the-same-column-updated
Note: As of now, April 2017, Power BI does not support different formats for the same column in a Table or a Matrix. This article shows a work around to achieve different formats for the same column. This work around can be applied to a Table or to a Matrix Report Visual.
You can download this Power BI desktop file from this link: https://1drv.ms/u/s!AjlEiXFjD5fu2SehP8jKkcpwJacf
There are many cases where we need to use a table or a matrix and we need to specify different formats in the same column. Showing the format with the numeric values makes the report easier to read than a simple number with no units.
In the case of this financial report below, we can see three different formats in the same column:
Currency ($), Currency and Thousand ($K), and Percent (%).
Another example is a side by side comparison of products. In the case below, we have different formats like: text, mAh, decimal number, Whole number and Amp formats, all of them in the same column.
I’ll show you this solution based on financial sample data downloaded from:
This spreadsheet will be imported using Power BI desktop and you have to choose the worksheet: financial. Notice that this solution works for both: Power BI imported mode and live connection mode to SSAS Tabular. In the case of SSAS Tabular, you would have to import the excel spreadsheet in the Visual Studio Project.
I created a flag URL for the image, which is not part of the objective for this article. Even though, I’ll show you the calculated column formula created in the Financial Table:
Flag = "https://image.ibb.co/" & SWITCH([Country],"France","d4vwba/fr.png","Mexico","h8uHhF/mx.png","Germany","nGmV2F/de.png","Canada","dsjuUv/ca.png","United States of America","c023NF/us.png")
The following table was easy to create. Each country has a row and we can do a row by row comparison.
Even though, this is not what we are looking for. We are trying to get a side by side column comparison having all country fields in one column. We can create a matrix moving the fields to the matrix sections: Column, Rows and Values as shown below:.
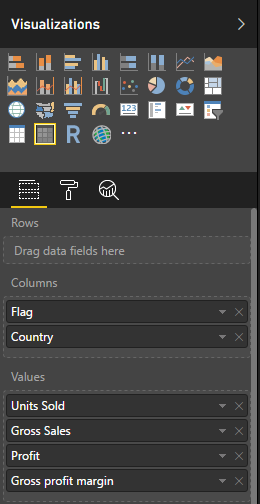
This is the Matrix Report version, after changing the flag and Country fields to the Column section in the Matrix. All fields under the configured Values section are shown as separate columns.
What I really want is only one column per country and also the columns header in the left side of the table as the very first column.

There are few challenges we have to overcome here:
The Solution
This are the steps we need to create a comparison report with only one column per country,
This ReportTable holds the structure, order and description of every row in the report, we do not include the Flag field, since we’ll use this field as report header.

If you are using Tabular SSAS with live connection, you can create the report table in your model by importing this from Excel or from a SQL Server database or you can also create the table with DAX using the following:
select 1 as [Index], 'Country' as [Description]

union all

select 2 as [Index], 'Units Sold' as [Description]

union all

select 3 as [Index], 'Gross Sales' as [Description]

union all

select 4 as [Index], 'Profit' as [Description]

union all

select 5 as [Index], 'Gross Profit Margin' as [Description]
Now, this is the trick: we need to create a Measures that will change dynamically based on the context of the row and it will calculate the corresponding measure with the correct format.
This measure will be created in the ReportTable.
ComparisonMeasure =

SWITCH(MAX(ReportTable[Index]),

1,

FIRSTNONBLANK(financials[Country],1),

2,

FORMAT(SUM(financials[Units Sold]),"###,###,###" ),

3,

FORMAT(SUM(financials[Gross Sales]),"$###,###,###"),

4,

FORMAT(SUM(financials[Profit]), "Currency"),

5,

FORMAT([Gross profit margin], "Percent"))
Then, we’ll use ReportTable[ComparisonMeasure] measure in the Values section of the Matrix. The Rows section will have the ReportTable[Description] field. Last, we’ll use the Financial[Flag] calculated column in the Columns section, as shown below.

This is how the report looks like now:
The table looks good. Side by side comparison with different formats in the columns was achieved! But there are still two issues with this Report.
Solution:
In order to fix the alignment, we’ll change the measure again and add empty spaces to force alignment to the right. This kind of alignment workaround is not pixel perfect, but we need to do this way until Power BI release a new alignment feature for table or matrix reports.
ComparisonMeasure =

VAR GrossSales=FORMAT(SUM(Financials[Gross Sales]),"$###,###,###")

VAR GrossSalesAligned=CONCATENATE(REPT(" ",20-LEN(GrossSales)),GrossSales)

VAR UnitsSold=FORMAT(SUM(Financials[Units Sold]),"###,###,###" )

VAR UnitsSoldAligned=CONCATENATE(REPT(" ",22-LEN(UnitsSold)),UnitsSold)

VAR Profit=FORMAT(SUM(Financials[Profit]), "$###,###,###")

VAR ProfitAligned=CONCATENATE(REPT(" ",20-LEN(Profit)),Profit)

VAR GrossProfitMargin=FORMAT([Gross profit margin], "Percent")

VAR GrossProfitMarginAligned=CONCATENATE(REPT(" ",23-LEN(GrossProfitMargin)),GrossProfitMargin)

RETURN

SWITCH(MAX(ReportTable[Index]),

1,

CONCATENATE(REPT(" ",4),FIRSTNONBLANK(Financials[Country],1)),

2,

UnitsSoldAligned,

3,

GrossSalesAligned,

4,

ProfitAligned,

5,

GrossProfitMarginAligned

)
After this change the Report looks better aligned.

Now in order to solve the order issue, we verify that the ReportTable[Index] field is selected as default in “Sort by Column” option.

Even though, after this the Matrix is still sorting by Description and not by Index. Then, I’ll create a calculated column in ReportTable, to concatenate the Index and Description in only one column:
SortedDescription = [Index] & " - " & [Description]
Now, the ReporTable shows the new column:
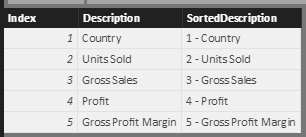
When SortedDescription replaces Description in the Rows section, the Matrix displays the correct sorting.

We add some slicers and we have both versions side by side matrix and simple table.

There is extra effort to create this kind of report in PowerBI. Even though, there are some cases where the side by side comparison in column and the formatted values are much easier to read than table with rows by row comparison. Especially, when there are multiple items or rows, it is easier for the end-user to compare columns side by side, where you can scroll up and down rather than scroll the table horizontally in a row by row comparison.
You can download this Power BI desktop file with this link: https://1drv.ms/u/s!AjlEiXFjD5fu2SehP8jKkcpwJacf